+86 15370610106
Payback Periods for Different Types of Photovoltaic Projects
Ⅰ. What is a payback period? Why is it important?
The payback period refers to the time required for a photovoltaic project to recover its initial investment through accumulated cash flow from energy savings, electricity sales, or subsidies. The formula is typically:
Payback Period = Initial Investment Cost ÷ Annual Average Net Cash Flow (Energy Savings + Electricity Sales + Subsidies – Operational Costs)
This metric measures the speed of investment recovery; the faster the payback, the lower the risk, and the more attractive it is to capital.
Ⅱ. Different Types of Photovoltaic Projects and Their Typical Payback Periods
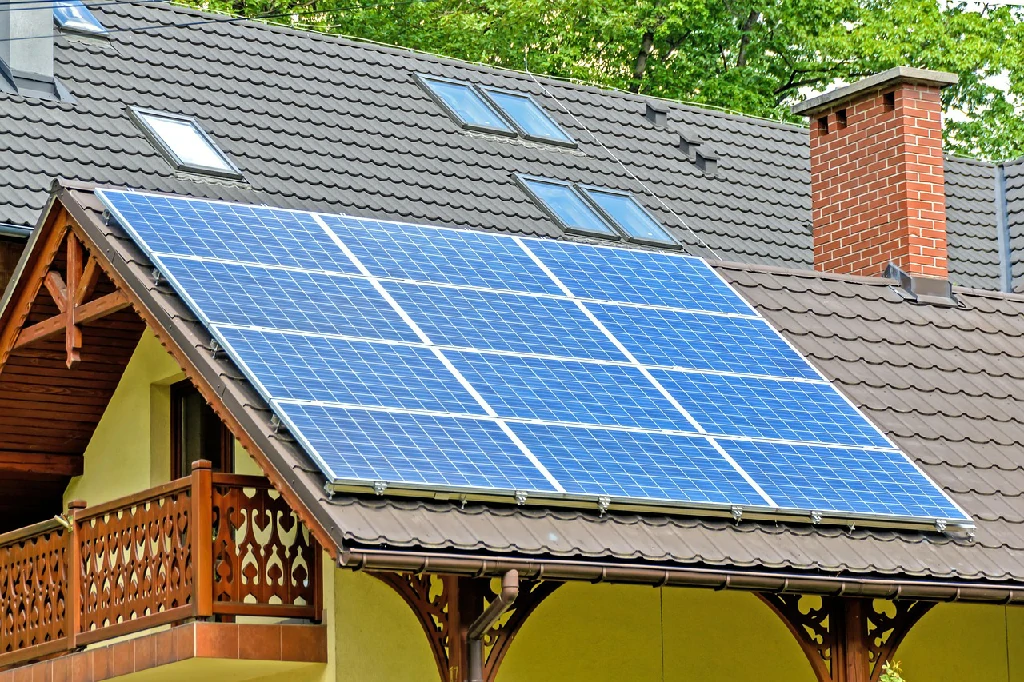
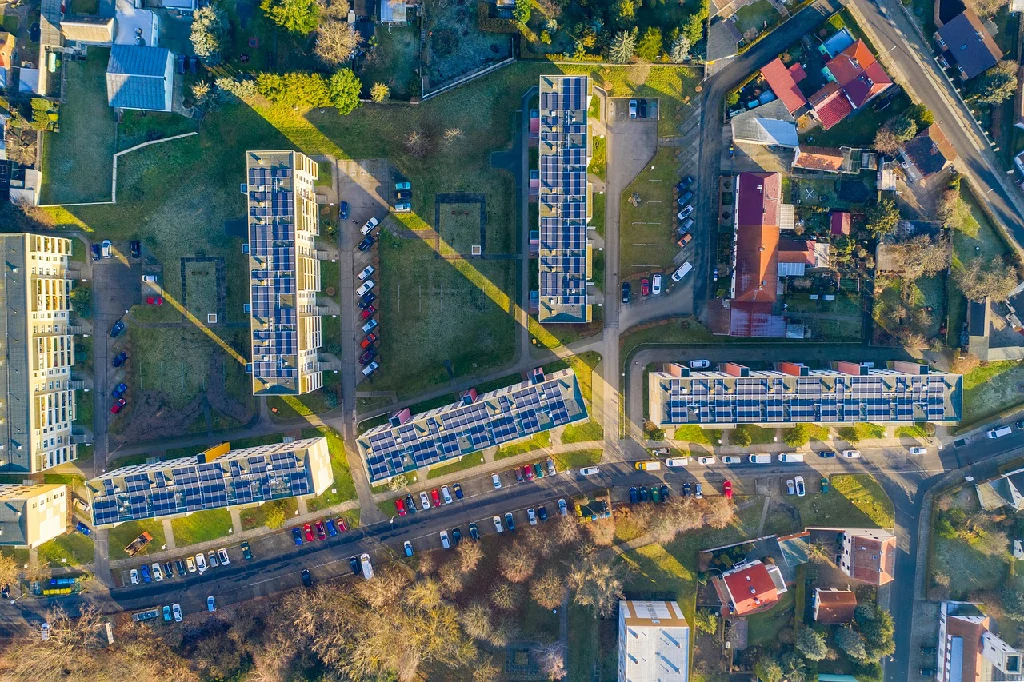
- Residential Rooftop PV
In residential settings in the United States, Europe, the Middle East, etc.: The average payback period is 6–10 years. In areas with high electricity prices, rapid electricity price increases, or tax/subsidy incentives, the payback period can be shorter.
In China: The annual return on investment is approximately 8–10%, with a typical payback period of 6–8 years.
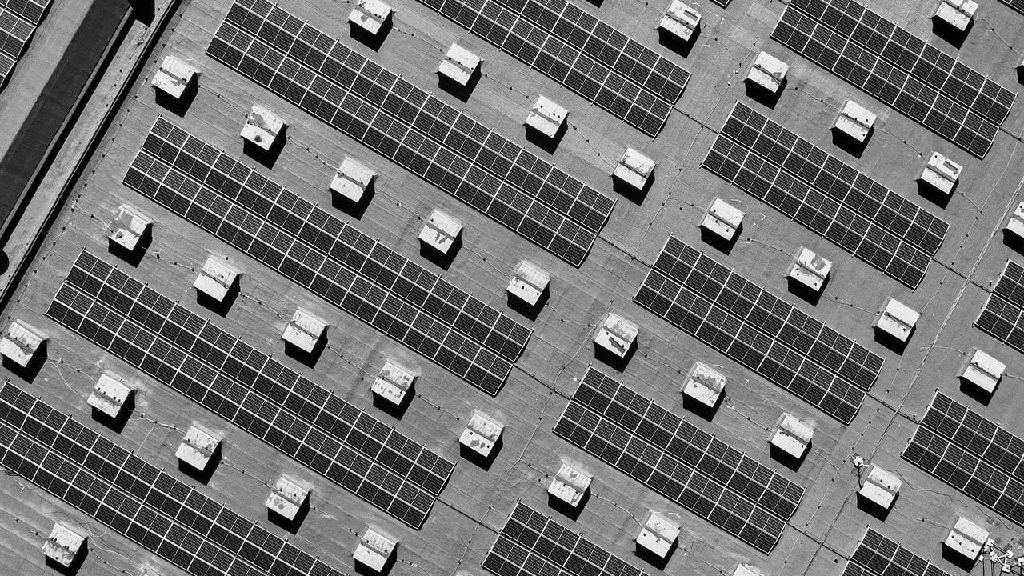
- Commercial and Industrial Rooftop PV
Globally, for business users, especially under peak electricity rates or tiered pricing, commercial projects can achieve annual returns of 10–15%, with typical payback periods of around 5 years.
In regions like California, business projects typically achieve payback in 3–5 years, while non-profit organisations may take slightly longer at 4–7 years.
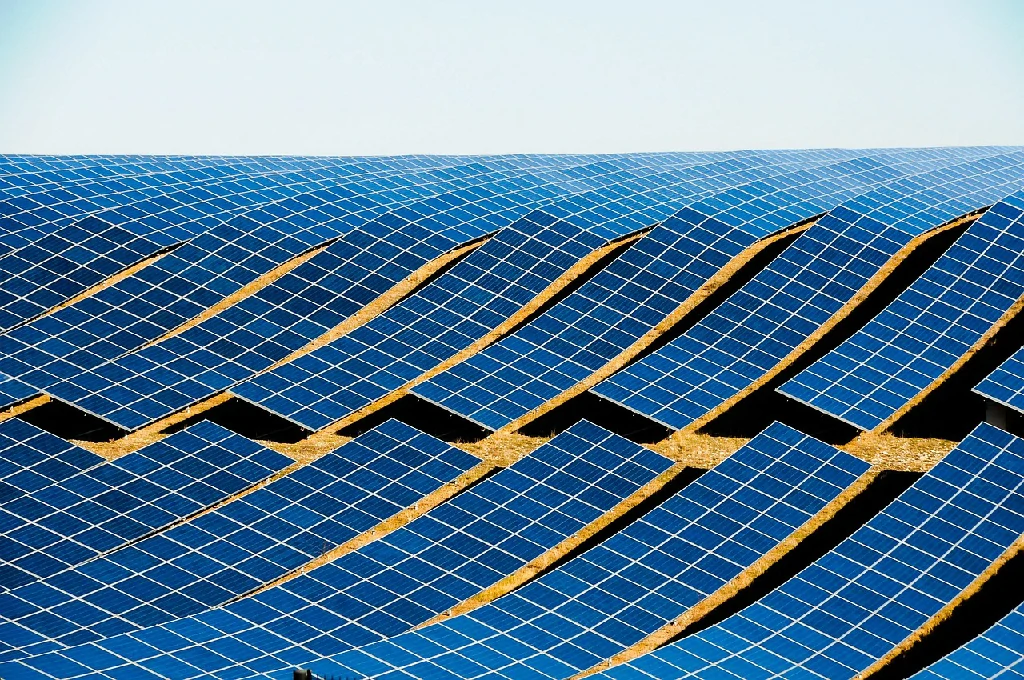
- Utility-scale PV Farms
Globally, mainstream utility-scale projects, especially in resource-rich countries (China, India, the United States, the Middle East, Africa, etc.), achieve annualised returns of 6–10%, with a typical payback period of 6–10 years.
In regions with poorer solar resources and reduced subsidies, such as the United Kingdom, utility-scale projects may have extended payback periods of 10–12 years.
- Community Solar
Community-shared solar projects allow multiple parties to invest and share profits, with payback periods varying significantly, typically ranging from 6–20 years. Local electricity prices, subsidies, and participation agreements all influence this period.
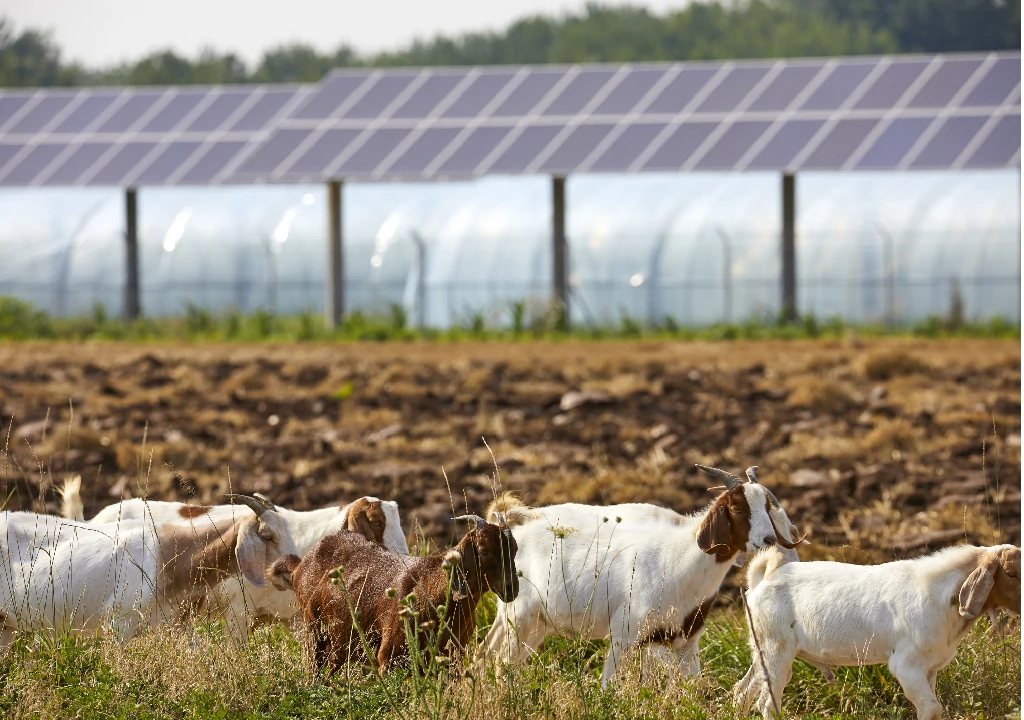
- Agrivoltaics
Systems combining agriculture and solar power, enabling farmers to benefit from both crop cultivation and electricity generation. The payback period is generally shorter, typically 4–8 years, with some cases even faster.
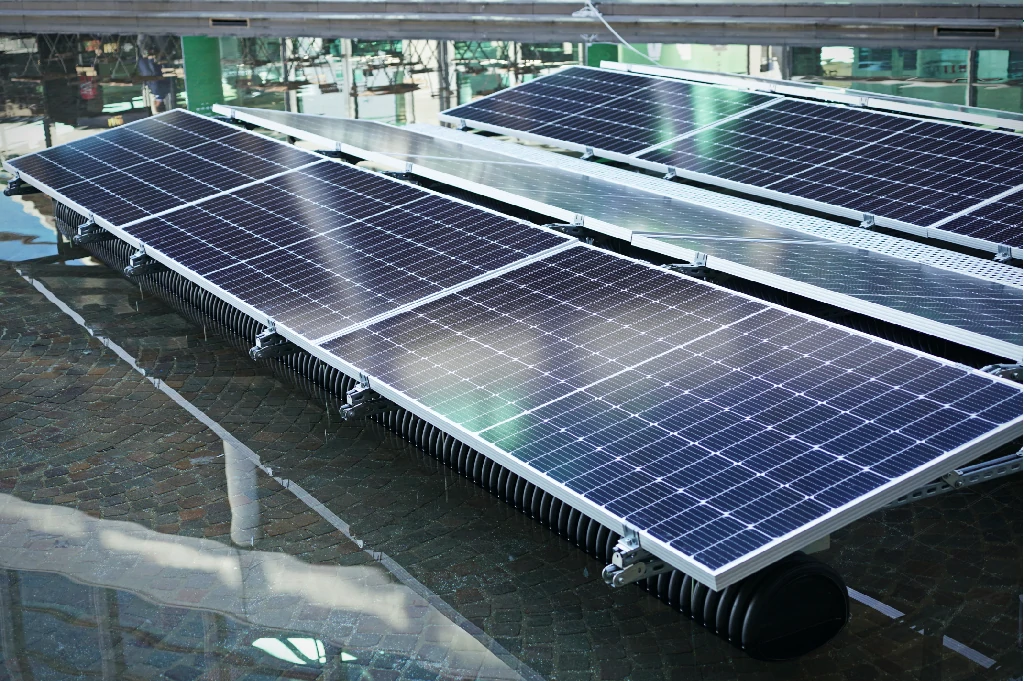
- Floating PV
PV systems installed on water surfaces benefit from cooling effects and lower land costs, resulting in an energy payback period of approximately 1.3 years (from an energy investment perspective, not a monetary one). The actual economic payback period typically ranges from 3 to 5 years.
Ⅲ. Key Factors Affecting the Payback Period
- Geographic and Solar Conditions
Regions with abundant solar resources (such as the Middle East, South Asia, Africa, and Southern Europe) have higher annual electricity generation, resulting in shorter payback periods. Northern Europe has longer payback periods.
- Electricity Prices and Subsidy Policies
Regions with high electricity prices and abundant subsidies (such as feed-in tariffs and tax credits) achieve faster payback; in countries with reduced subsidies and lower electricity prices, payback is slower.
- System Scale and Project Type
Small-scale distributed systems offer flexible and rapid returns; however, large-scale centralised projects, despite higher total costs, have lower cost per kilowatt-hour and stable revenue streams, enabling the overall payback period to be controlled within 6–10 years.
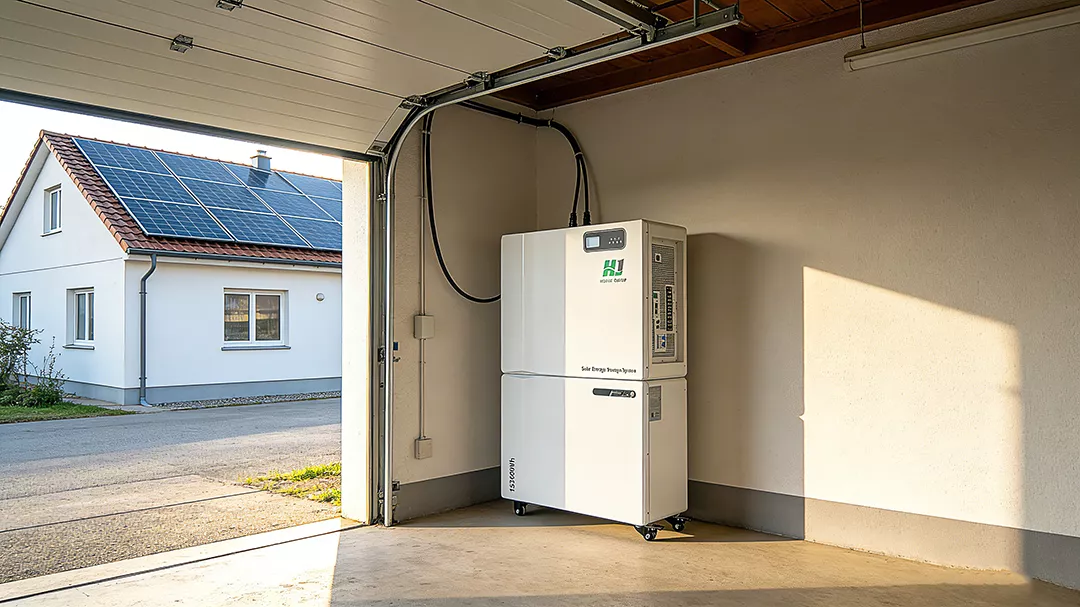
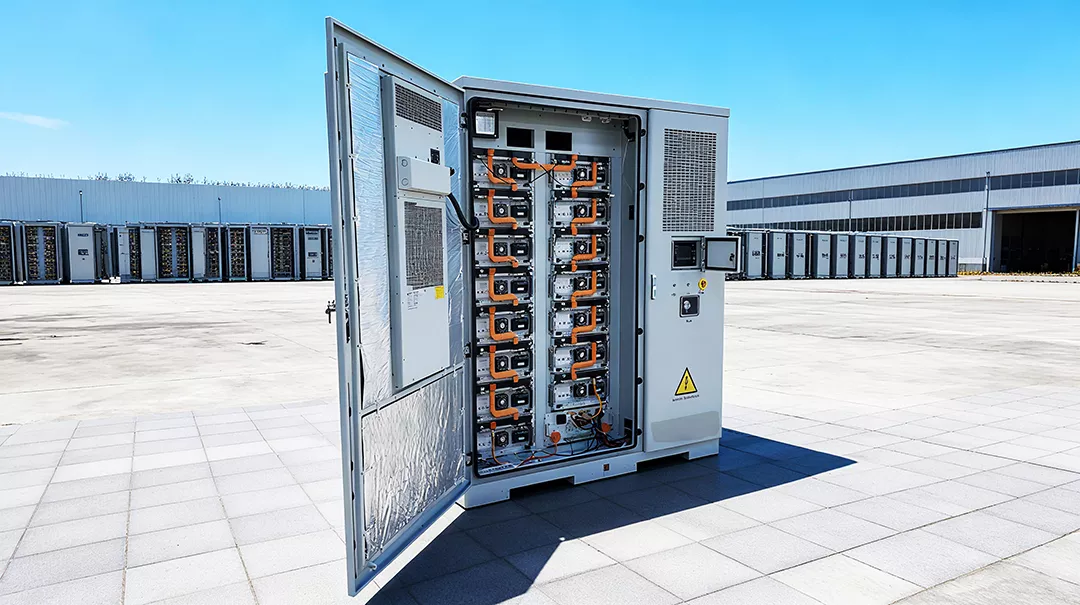
- Whether equipped with energy storage systems (photovoltaic-storage)
Photovoltaic-storage systems increase self-consumption rates but raise initial investment costs. For example, in China’s residential photovoltaic-storage cases, the payback period is approximately 6 years; factors such as technological costs and local electricity price tier structures also influence the cycle.
- Operations and maintenance costs and system degradation
As panel components age and operations and maintenance costs increase, actual cash flow is slightly lower than theoretical models. Therefore, it is recommended to reserve a 10–15% depreciation margin.
Ⅳ. Comparison table of typical types from a global perspective
| Project Type | Annual yield (estimated) | Typical payback period (years) | Regional settings examples |
| Residential Distributed PV | ~8–10% | 6–8 / 6–10 | China, the United States, the United Kingdom, the Middle East, etc. |
| Commercial/Industrial Distributed PV | ~10–15% | ~5 | Corporate rooftops, shopping malls, hospitals, etc. |
| Utility-Scale Ground-Mounted PV | ~6–10% | 6–10 / 10–12 | China, India, the United Kingdom, Africa, the United States, etc. |
| Community PV | Variable | 6–20 | North America, Europe, developing countries, etc. |
| Agrivoltaic | Simultaneous agricultural and power generation income | 4–8 | China, Japan, Europe, etc. Agricultural solar integration projects |
| Floating PV | High efficiency, land saving, space saving | Energy payback ~1.3 years; economic payback approx. 3–5 | Countries with abundant lake, reservoir, and water surface resources |